Blogs
The latest cybersecurity trends, best practices, security vulnerabilities, and more

Finding Patient Zero with Endpoint Forensics
By Ilya Kolmanovich and Joe Malenfant · February 25, 2025
We as an industry have been using EDR (endpoint detection and response) for over a decade, and it’s been great at identifying malicious behavior in near real time. In the last few years security research teams at Trellix have witnessed attacks that erase their tracks through various means, making it difficult for EDR to detect the initial infection point, or the full scope of a compromise. This is where endpoint forensics comes in.
EDR with Forensics not only collects real-time events like a typical EDR solution, but also captures forensics artifacts when malicious activity occurs. The importance of collecting these artifacts at the time of detection is something that gives EDR with Forensics an advantage over traditional EDR solutions. It helps to kick start the investigative process and enables analysts to shorten the time an attacker is present in an organization.
Initial compromise
One of the first steps in an attack chain is initial compromise, defined by MITRE tactic TA0001 and shown in the diagram below (Figure 1).
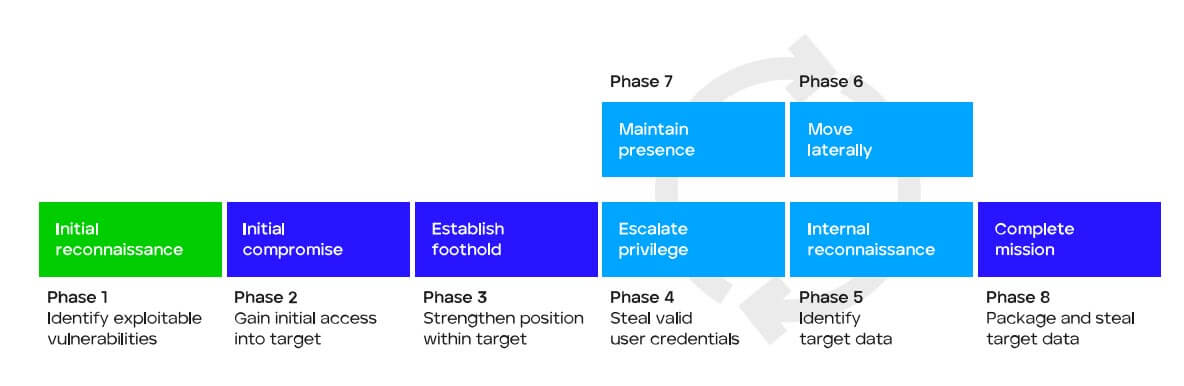
At this stage an attacker has successfully compromised the organization and will attempt to establish a foothold in the enterprise, allowing them unfettered access. In an ideal scenario, when that happens an analyst will get an alert indicating that malicious activity has occurred and will initiate an investigation. Even in the most optimistic scenarios, there will be some time between when an alert is generated and when the investigation is initiated. During this time an attacker can cover their tracks, removing critical indicators of compromise from the system. This is why collecting forensic artifacts as soon as possible is critical to a successful investigation.
Phishing as a vector
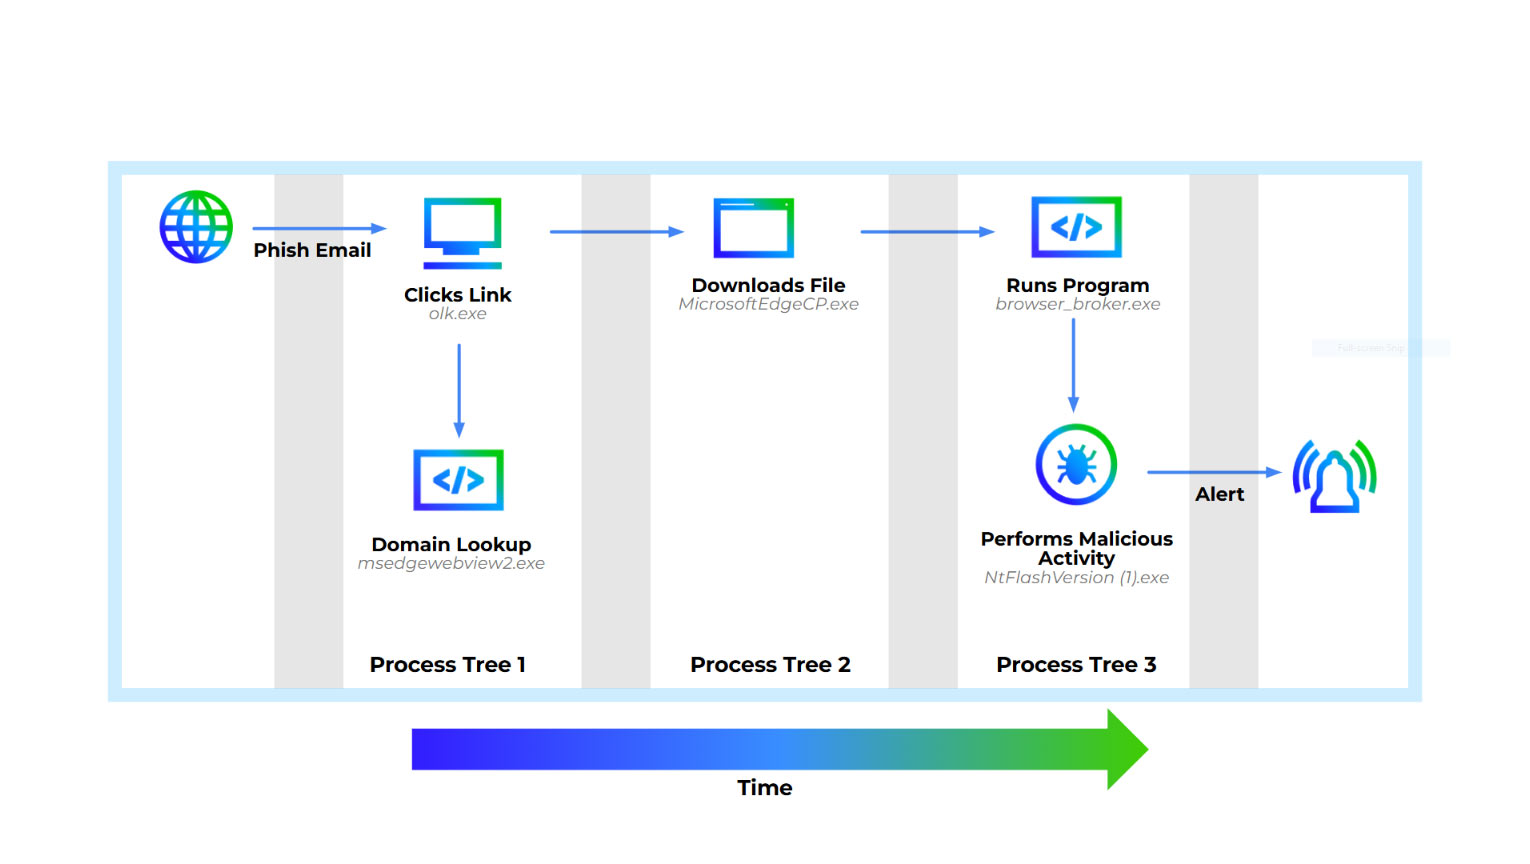
This scenario, adapted from MITRE’s Turla evaluation, shows how a successful phishing attack can be investigated using EDR with Forensics. The attack plays out as shown in Figure 2. The victim receives a phish email with a malicious link. They are then tricked into downloading and running a fake installer. When launched, it drops an embedded executable and modifies the registry to run it on logon.
![Figure 2: Phish Attack Flow [1]](/en-us/img/newsroom/stories/endpoint-forensics-2.jpg)
Investigation
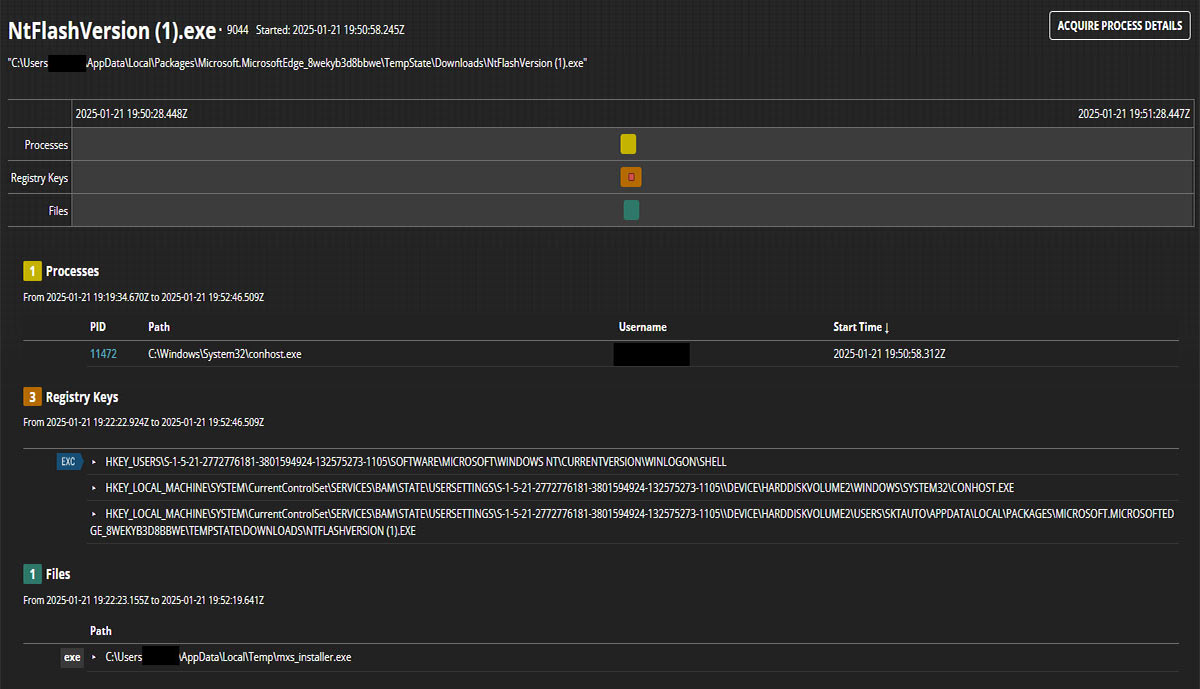
During the attack outlined above, an alert is generated which will notify the analyst of the malicious activity (Figure 3). At the same time a forensics triage package is collected from the endpoint. That package contains critical information the investigator can use to find the root cause of the attack. It includes process, file, network, and browser activity among other information. This information is presented in both a summarized (Figure 4) and detailed (Figure 5) form within the Forensics interface.
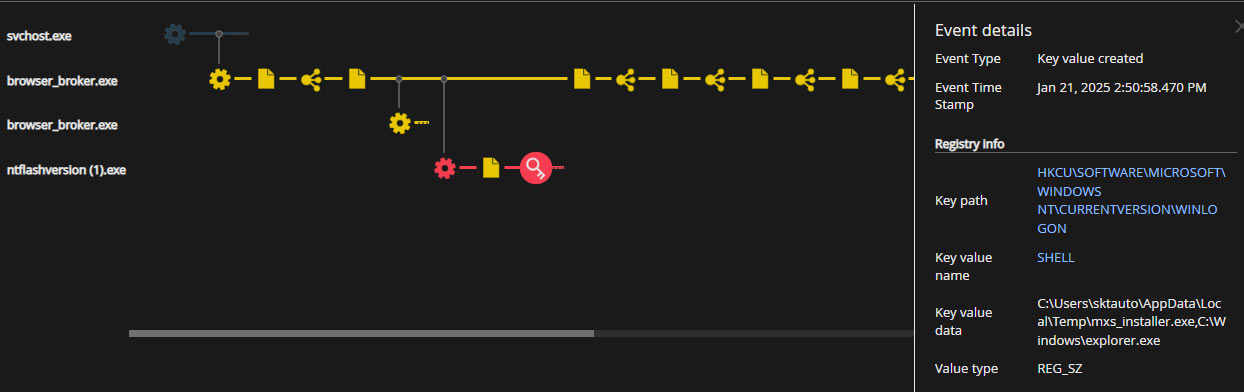
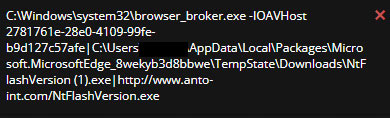
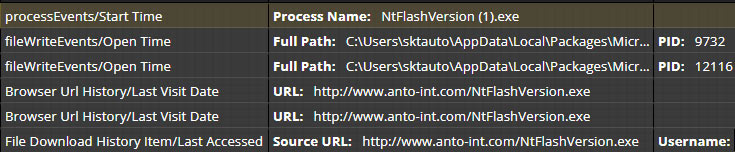
Looking at the alert we can see that the “browser_broker.exe” process spawned “NtFlashVersion (1).exe” which triggered the alert. A quick search on the internet shows that the “browser_broker.exe” process is part of the Edge browser and will spawn downloaded executables [2]. That said, we can assume that “NtFlashVersion (1).exe” was downloaded from Edge and then run by the user. The sibling process’s command line, another instance of “browser_broker.exe”, shows both the downloaded path and the source URL of the executable (Figure 6).
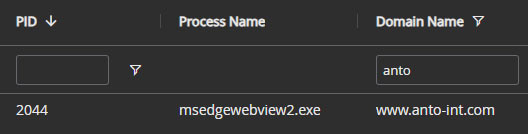
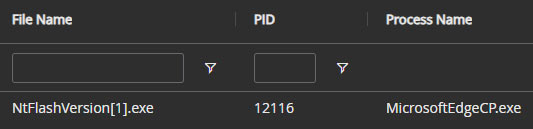
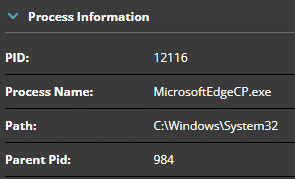
Using this information we can start searching for malicious activity. Some things we are interested in are DNS lookups, downloads, file activity, and browser history. Lets first look at what we can find using the EDR interface. Digging into the event data shows that the DNS lookup for the malicious domain was done by the “msedgewebview2.exe” (PID 2044) process (Figure 7) and the file was created by “MicrosoftEdgeCP.exe” (PID 12116) process (Figure 8).
At this point we have potentially identified three separate process trees. The one from the alert, one for the file download, and one for the DNS lookup. We could try to manually piece these together but there’s a better way.

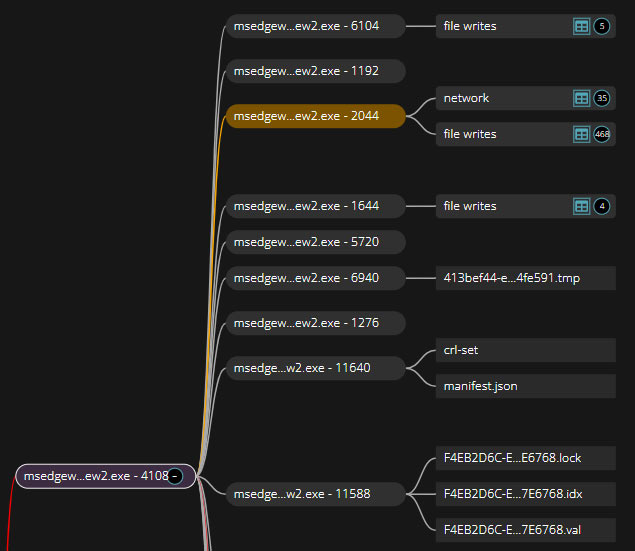
Switching to the Forensics interface and opening the Storytime graph for the alert we can see part of one of the process trees we are interested in (Figure 9). This shows that the “olk.exe“ process spawned an instance of “msedgewebview2.exe” (PID 4108) which eventually triggered the alert. That isn’t the ”msedgewebview2.exe” process we identified earlier in our investigation so we need to dig further.
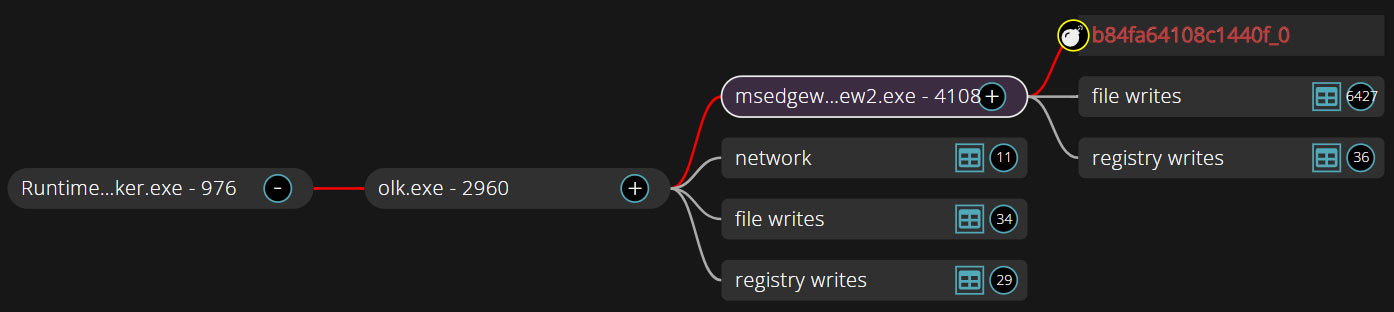
Fully expanding the graph (Figure 10), we can see the process that performed the DNS lookup was a child of the “msedgewebview2.exe” (PID 4108) process shown in the collapsed view. We can also see that the grandparent process is “olk.exe” (PID 2960), which is related to the Microsoft Outlook email client [3].
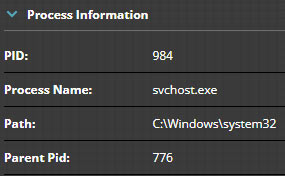
Next lets rebuild the process tree for “MicrosoftEdgeCP.exe”. In this case it is a manual process, but not difficult. To do so we need to search the triage data to find the process (Figure 11) and its parent (Figure 12) and so forth until we have completely rebuilt the tree. In this case it’s trivial since the browser process was a child of an instance of a well known “svchost.exe” (PID 984) process.
At this point we have a good understanding of what’s happened. We can surmise that the user got an email with a link to the executable and clicked it, which triggered the browser to download the file. Once the download was complete, the user executed the malware that caused the alert to hit.
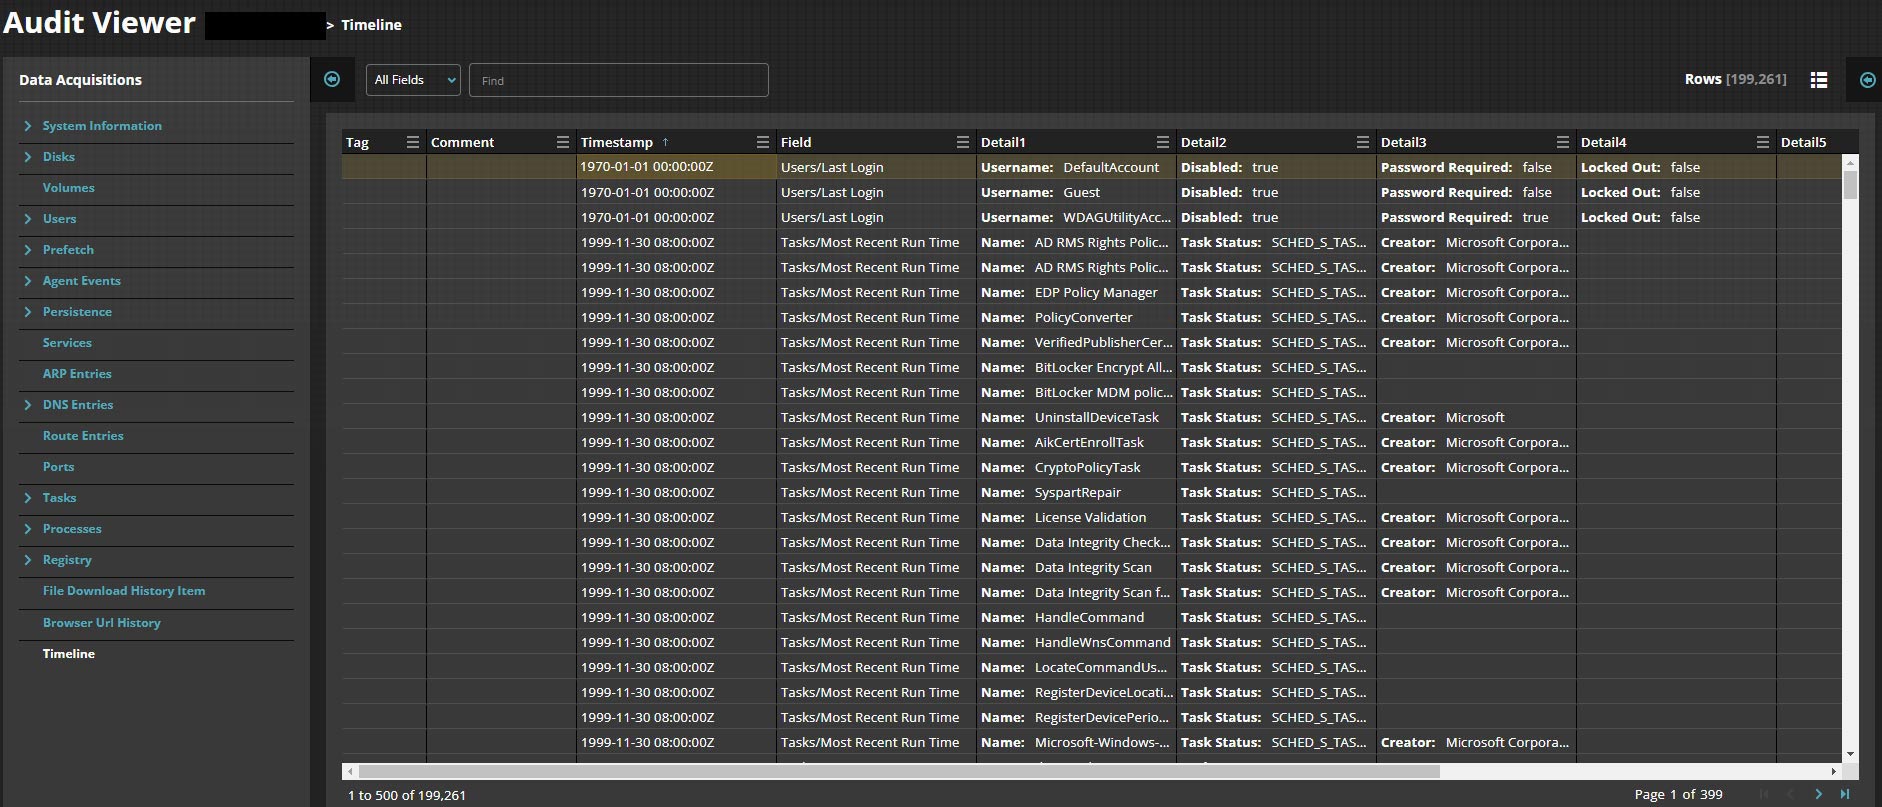
We can confirm by going through the forensics data using the timeline view in Audit Viewer (Figure 13).
Now that we’ve identified the root cause of the malicious activity we can create a diagram of the user and system activities and their associated process trees (Figure 14).
Conclusion
In the scenario above we showed how using EDR with Foresics can accelerate the investigative process. It enables the investigator to get ahead of the attack and jump starts the investigative process. By collecting critical forensics artifacts when they happen it is much harder for an attacker to cover their tracks after the fact. It also shortens the time between the discovery of an attack and the remediation of the malicious activity. This both reduces the impact of the attack on the enterprise and the workload for the analyst.
References
-
https://github.com/center-for-threat-informed-defense/adversary_emulation_library/blob/master/turla /Resources/Images/CarbonSoftwareDiagram.png - https://blog.exodusintel.com/2019/05/27/pwn2own-2019-microsoft-edge-sandbox-escape-cve-2019-0938-part-2/
- https://www.spyshelter.com/exe/microsoft-corporation-olk-exe/
RECENT NEWS
-
Apr 7, 2025
Trellix Strengthens Focus on Customer Engagement and Regulated Industries with Executive Appointments
-
Feb 5, 2025
Trellix Accelerates Secure Cloud Adoption in Australia with New Government Accreditations
-
Jan 28, 2025
Trellix and NEXTGEN Accelerate Cybersecurity Platform Adoption in Australia and New Zealand
-
Jan 22, 2025
Trellix Welcomes New CEO to Lead Next Phase of Growth
-
Jan 14, 2025
Trellix Accelerates Global Partner Growth with Revamped Xtend Partner Program
RECENT STORIES
Latest from our newsroom
Get the latest
Stay up to date with the latest cybersecurity trends, best practices, security vulnerabilities, and so much more.
Zero spam. Unsubscribe at any time.